
Measuring the user experience – is that even possible? User experience is a tricky thing: how someone rates an experience is subjective by nature (as it is something that happens “internally”). But if we want to compare the experience (which is important to understand for example if the user experience is improving), we need to use numbers.
But how do we get those numbers? In UX we mostly use qualitative data: from interviews, observation and diary studies. The outcome helps us to understand underlying motivations and the Why behind users’ behaviour, but it rarely includes any numbers. We struggle to come up with general rules, and our most favorite answer to any question is: “It depends.”
How can we fit metrics in there? Can numbers be meaningful for UX?

Why should you care about UX metrics?
As UX designers we are constantly making design decisions and are impacting the user experience. One of the challenges we are facing in UX design is the subjectiveness of design decisions. Yes, there are “best practices” out there, yes, there are certain standards and heuristics – but our world is not made out of stencils, every problem and use case is different and requires a unique solution.
But if there is no “one size fits all”, how to we make sure that our design decisions are getting us in the right direction? That’s where metrics and numbers come in: We want to measure that we achieve the desired outcome. The desired outcome is often a specific action or a behaviour from our users. And that can be measurable.
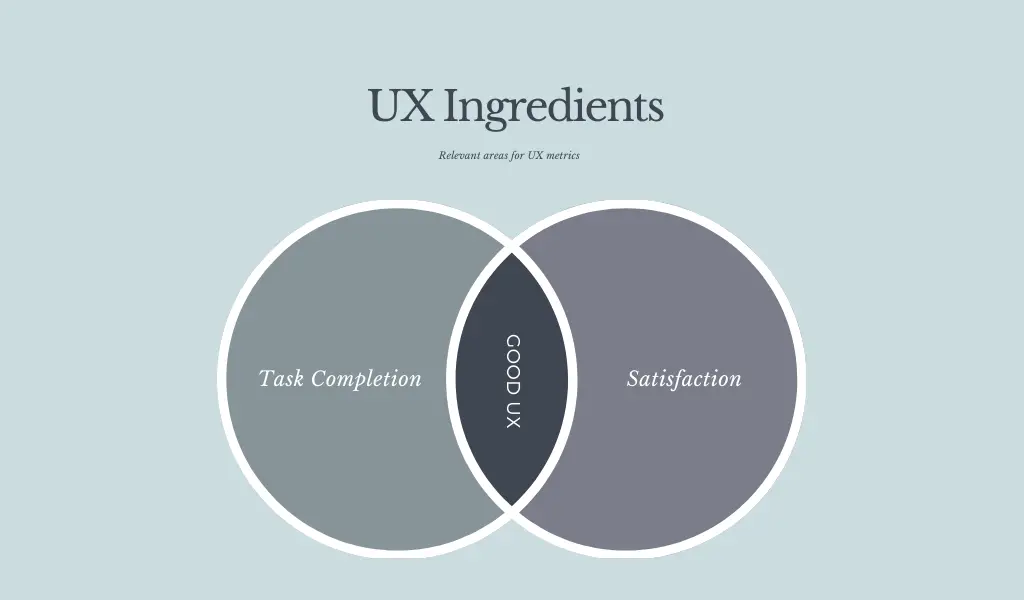
A good user experience is often dependant on two main aspects:
- Task completion: How easy is it for a user to complete what they intended to do (i.e. find & buy a product, book an appointment, share an article…)?
- Satisfaction: How enjoyable is the interaction (so that the user would repeat it if needed)?
Let’s take a look at how we might measure these two ingredients.
What UX metrics do we have?
If we break UX down into those two key components, we could measure:
- Task completion with behavioural metrics (numeric systems that describe what users do)
- Satisfaction with attitudinal metrics (self-reported measures that describe how users feel).
1. Behavioural metrics
How do we measure behaviour? The most relevant resource for websites are data analytics (i.e. Google analytics). We can find all kinds of numbers that describe what our users do on our website – for example how often they visit our website, where they click most often, how much time they spend on our website.
To make use of all these wonderful numbers, we have to be clear about what we want to find out: what is the desired behaviour, the action that we would like our users to do? We might want our customers to buy products on our website (= complete an online purchase successfully) and come back often (= return quote). And we assume that by accomplishing the task (buying a product), we provided a good user experience.
Of course this is a very simplistic view point, but looking at these numbers give us some indication about the user experience.
Herr are some helpful metrics to look at in data analytics. Pick the ones that are relevant for your specific business and user goals:
- Visitors: Total number of people that come to our website, new vs returning visitors, time trends (when are visits high vs lows)
- Pageviews: Number of pages, most visited pages, least visited pages, common path between pages
- Time spent/ Bounce rate: Time that a user spends per visit/ per page
- Conversion rate: how many users show the behaviour you want them to show (i.e. sign up for a newsletter?)
- Average order value: total revenue/ number of checkouts
- Abandonment rate: how many users leave products in their basket without completing the purchase
Another source for behavioural metrics are usability tests. While observing users in how they accomplish a goal or a task with a system or a website, we can measure certain aspects:
- Completion rate: can a user complete the task successfully
- Error rate: percentage of users who made a mistake during a specific task
- Time on task: how long did it take a user to complete a task
Be aware though: a usability test is always an artificial situation and is influenced by other factors, which make the data less reliable.
2. Attitudinal metrics
To measure how users feel, we ask them to rate their emotions on a scale. There are some standardized measurements out there, often containing a single question, that help to gage a users’ perception.
The most popular is the NPS (Net Promoter Score): Measures the loyalty of your customers with a 10-scale rating question (How likely is it that you would recommend this company/product/service/experience to a friend or colleague?).
The biggest critique about the NPS is that this question asks customers to predict their behaviour into the future. This is a big no-no in user research as we know that what a person SAYS the will do and what they actually DO are not always the same.
Instead of asking customers what they THINK they WILL do, we could better ask them what they HAVE DONE: Have you recommended this product to someone within the last months?
Read more about NPS critique and improvements.
Similar questions to the NPS are:
- CES (Customer Effort Score): How easy was it to use our service/ product today?
- CSAT (Customer Satisfaction): How satisfied are you overall with our service/ product?
Those questions are often included on a website after a user has spend some time there or finished a task. We can also use self-reported measurements in usability tests. The two most popular scales are:
- SEQ (Single Ease Question): Similar to the CES, a single question to rate the effort of a task (How easy was it to complete the task?)
- SUS (System Usability Scale): A standardized questionnaire with 10 items, mostly focused on software and not websites
Which metrics should I use?
Now that we have looked at some tools and ways to describe behaviour and attitude in numbers: how do you know which ones are right for you?
It depends…on what you want to measure. You need to be clear about your goals, both your business goals and your customer goals: what do you need your customers to do and/ or feel to get your desired impact for your business?
Once you have your theory about what actions will influence your business, you can define the metrics that are relevant to you: pageviews, conversion rates, attitude toward your business…
Use the following template to define you ideal customer actions:

Summary
Measuring UX is needed to identify if you are going into the right direction with your design decisions. But be mindful:
- Don’t get lost with the metrics: be clear on what you need to get numeric feedback on and start small.
- Keep asking questions: look at the numbers and figure out what else you need to make meaning of it.
- Combine quantitative data with qualitative data to come to better conclusions.

